
The president’s party has lost House seats in all but two midterms since World War II. Since 1950, control of at least one chamber has changed hands in 9 of 19 midterms: the House alone three times, the Senate alone three times, and both chambers three times. Here is how the S&P 500 behaved after each outcome.
19 for 19
S&P 500 higher a year after every midterm since 1950
+18.8%
Average return in the 12 months after Election Day
−16.2%
Average drop from Jan. 1 to Election Day in midterm years
66%
Odds both chambers flip in 2026 (Polymarket, 9/23)
01The Outcome Has Mattered Less Than You Might Think
Returns After a Midterm, by Outcome
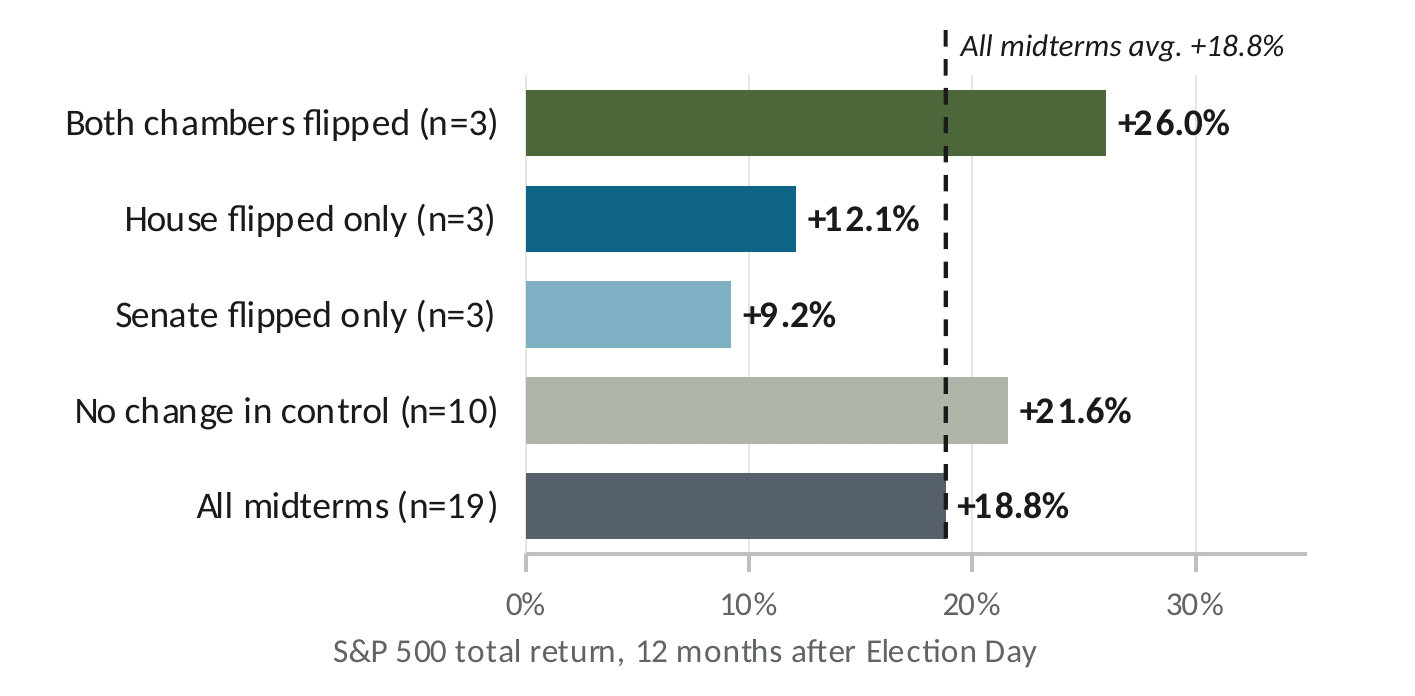
S&P 500 total return, 12 months after Election Day; simple group averages, 1950–2022. Dashed line: all-midterm average. Source: Bloomberg
Reading the Chart
- Positive every time. Every outcome group, and every individual midterm since 1950, saw the S&P 500 higher a year later.
- Double flips led, but on just three data points, from +8.7% (2006, a year before the financial crisis) to +38.8% (1954).
- Single-chamber flips lagged, largely due to outside shocks: the 1987 crash (after ’86), the 2011 U.S. downgrade (after ’10) and the 2015 oil and China slump (after ’14).
- Takeaway: the economy, earnings and the Fed have mattered more than which chamber changed hands.
02Pain Before, Gain After: The Midterm-Year Pattern
Drawdown Before vs. Return After
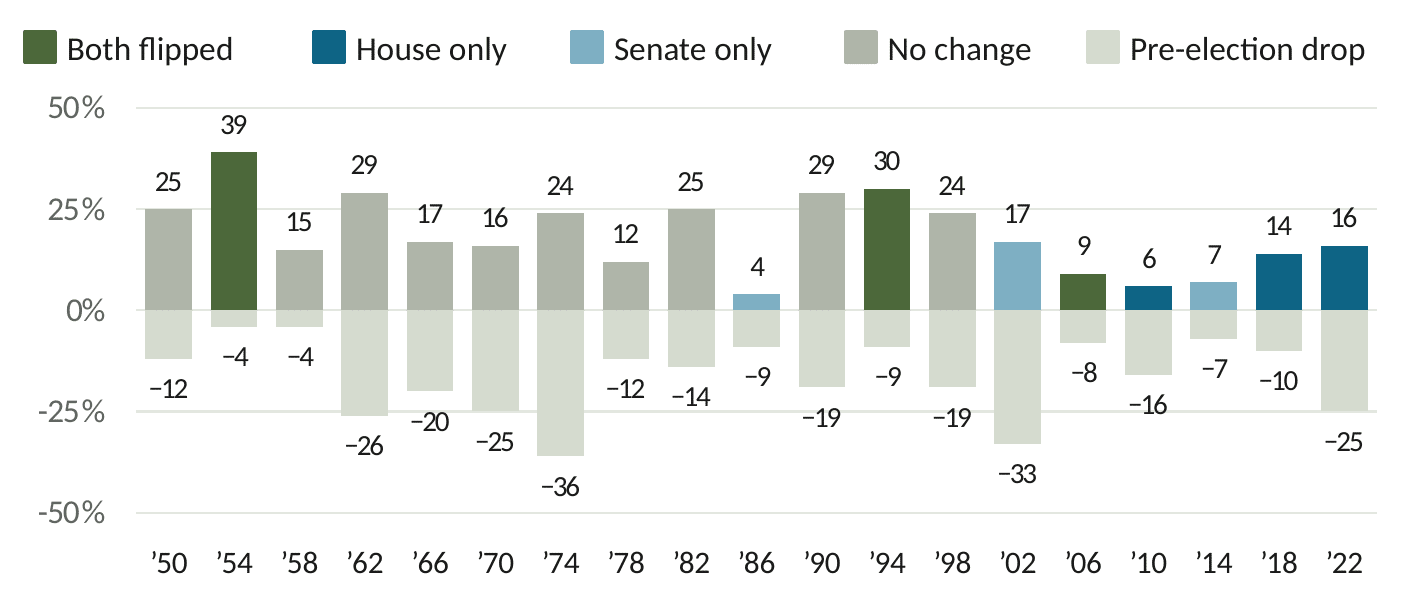
S&P 500 total return. Above zero: next 12 months, by outcome (avg. +18.8%). Below zero: largest drop, Jan. 1 to Election Day (avg. −16.2%). Source: Bloomberg
Reading the Chart
- Midterm years are bumpy. The index has dropped 16% on average before Election Day, with double-digit declines in 13 of 19 cycles.
- Relief has tended to follow. Once results are known, a major source of uncertainty fades; the next 12 months averaged +18.8%.
- The deepest drops weren’t political. 1974, 2002 and 2022 reflected an oil shock, the dot-com bust and Fed tightening.
- 2026 has broken the script so far: stocks sit near record highs after a shallow spring pullback of roughly 9%.
03The 2026 Set-Up: Any Flip Ends One-Party Control
Republicans hold the White House, a 53–47 Senate and a narrow House majority; Democrats need a net gain of roughly three House and four Senate seats. Because one party holds the “trifecta,” any flip would return Washington to divided government.
What Prediction Markets Are Pricing
- 66% Both chambers flip (Democratic House & Senate)
- 27% House flips only (R Senate, D House)
- ~7% Status quo or Senate only
Implied probability of each congressional outcome, as of Sept. 23, 2026. Source: Polymarket
Two-in-three odds of a Democratic sweep, one-in-four of a split Congress. Odds move with news; they are not forecasts.
Smaller Rally When Control Ends
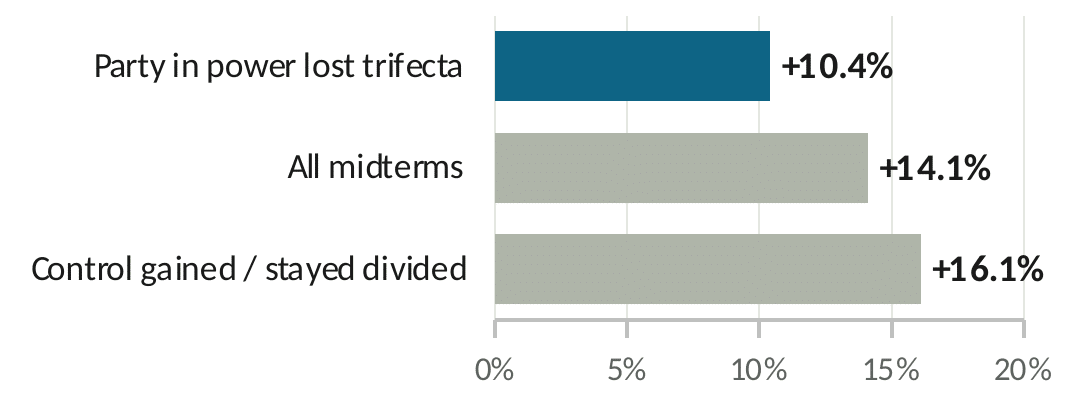
Average S&P 500 total return, 6 months after the midterm, 1970–2022. Source: BlackRock
Stocks still rose on average when a trifecta ended, but by less, as markets re-priced what could pass. That is the relevant comparison for any 2026 flip.
04Scenario Playbook for November 3
| Scenario | Government | Past cases* | Potential policy and market read-through |
|---|---|---|---|
| Both chambers flipMarket odds: ~66% | Divided: opposition Congress | 1954, 1994, 2006 Avg. +26.0%+8.7% to +38.8% | Gridlock, veto standoffs and more oversight. Spending bills become leverage, raising shutdown risk. The 2025 tax law is hard to change either way; policy shifts to executive action. |
| House flips onlyMarket odds: ~27% | Divided: split Congress | 2010, 2018, 2022 Avg. +12.1%+5.8% to +16.4% | House gains the purse strings and subpoena power; most new bills stall, though the Senate can still confirm nominees. Expect more executive action and spending brinkmanship. |
| Senate flips onlyMarket odds: ~7% combined | Divided: split Congress | 1986, 2002, 2014 Avg. +9.2%+4.3% to +16.6% | Senate controls confirmations (judges, cabinet, Fed Board nominees) and can block House-passed bills. Legislative output slows. |
| No change (status quo)Market odds: ~7% combined | Unified control continues | 10 midterms Avg. +21.6%+12.4% to +29.3% | Policy continuity: the tax, trade and deregulation agenda can keep advancing, though the 60-vote filibuster limits most bills outside budget reconciliation. |
*Midterms since 1950; average and range of S&P 500 total return in the 12 months after Election Day, 1950–2022. Three cases per flip scenario is a very small sample and is not a forecast. Senate-only and status quo odds are combined.
05What This Means for Investors
Vote at the ballot box, not in your portfolio.
Stocks rose after every midterm since 1950, whichever chamber flipped. BlackRock found that moving to cash when one’s party was out of power roughly halved wealth since 2013.
Think sectors, not the index.
Results tend to re-price policy-sensitive areas such as health care, energy, defense and financials more than the broad market. Diversification helps absorb that.
Expect noise, not a verdict.
Volatility tends to rise into November, and rallies have often begun about a month before Election Day. Waiting for certainty can mean missing the rebound.
Keep the focus on fundamentals.
Inflation, the Fed’s path, oil prices and earnings, including AI investment, have mattered more for the next 12 months than the election itself.
Sources & Methodology
Midterm returns and drawdowns: Bloomberg, via First Trust Advisors, Midterm Election Client Resource Kit; S&P 500 total return measured from Election Day to one year later, and largest decline measured from Jan. 1 of the midterm year to Election Day, 1950–2022. Outcome groups reflect whether majority control of the House and/or Senate changed at each midterm election; group figures are simple averages. Six-month returns by trifecta outcome and the cash-timing illustration: BlackRock, What history says about 2026 midterm elections and market performance (June 11, 2026), using Bloomberg and Morningstar data for midterms 1970–2022. Market-implied odds: Polymarket, “Balance of Power: 2026 Midterms” (Sept. 23, 2026). 2026 market conditions as of early September 2026. Data are subject to revision.