
I’m not here to add another forecast on where yields are headed or explain why. The bond market is often viewed as “the adult in the room,” and I treat it no differently. At Shaker, we use this market less as a crystal ball and more as a guide to the environment we are investing in.
We watch what yields are actually doing, consider which factors and sectors tend to work best in that backdrop, and make incremental portfolio adjustments where appropriate. Our portfolios are still built around high-quality, fundamentally sound large US-based companies that have dominated the global equity markets and returns for decades. If and when their dominance changes, we will change. Until then, we find value in pairing that strategic asset allocation discipline with a tactical layer that better positions our clients for the market we have, rather than the one we expect.
Two-Year US Treasury Yield and Effective Fed Funds Rate Spread
One way to gauge how far bond traders think the Fed may be from the right policy stance is to compare the 2-year US Treasury (UST) yield with the effective Fed Funds Rate (FFR). It’s not simply whether the market thinks the Fed should be higher or lower, rather the size of the gap. When the 2-year yield is at least 50 basis points above or below the effective Fed Funds Rate, certain sectors and factors have historically tended to outperform the broader market.
The spread has been wider than that threshold going back to early June. As of August 27th, that spread was +61 basis points. We saw similar setups in late 2016 and early 2017, through much of 2018, and for most of 2022. Let’s look at a couple areas of the market that have tended to do relatively well in this kind of rate environment for some insight on where capital might continue to flow if these rate trends also continue.
US Treasury 2-Year Yield and Effective Fed Funds Rate Spread

Top: Overlayed 2y UST Yield and Effective Fed Funds Rate; Bottom: 2y Yield – Effective FFR Spread. Source: Stockcharts.com
Large Cap Healthcare Sector Relative to the S&P 500
Within the S&P 500, the Healthcare Sector has substantial exposure to big pharma and managed-care companies. These are two industries that tend to be more defensive in nature relative to the market overall. When rates are rising, investors can become more anxious about long-duration assets and higher borrowing costs for companies. Adding portfolio exposure to an area like healthcare can help dampen portfolio volatility, especially when the core of the portfolio is made up of companies with long-term growth profiles. Illustrated below is healthcare’s relative performance to the S&P 500, calling out similar rate optics to today. When this ratio goes up, healthcare is outperforming.
Large Cap Healthcare Sector Relative to S&P 500
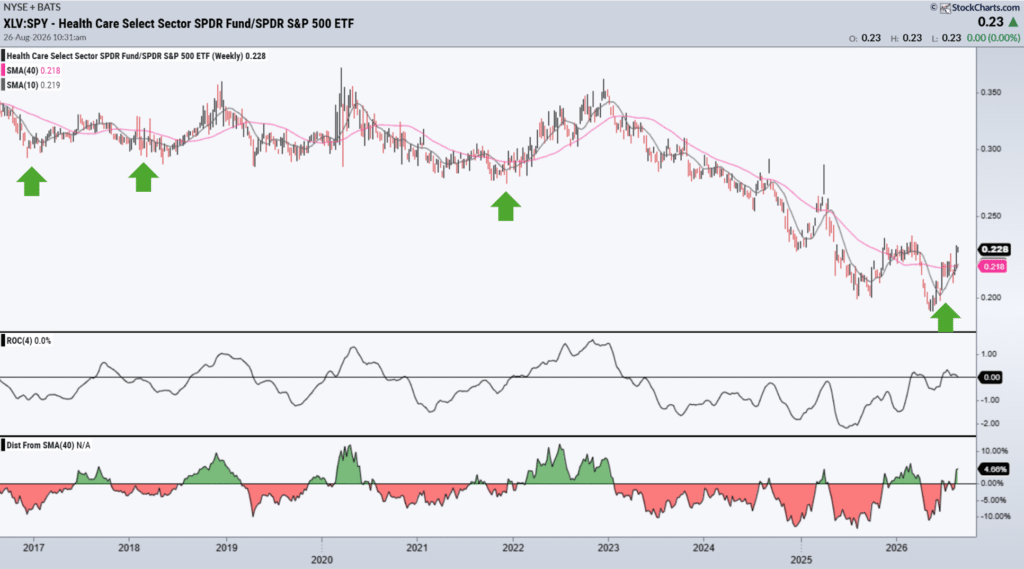
Top: Healthcare SPDR ETF / S&P 500 ETF Ratio; Middle: 40wk MA, 1-month Rate of Change; Bottom: Ratio’s distance from 40wk MA. Source: Stockcharts.com
S&P 500 Low Volatility > High Beta
It may still be a little early to call a relative bullish turn in the low-volatility factor, but this is a more diversified way to express rising rate concerns than narrowly adding sector exposure. The Invesco Low Vol ETF is an equal-weighted basket of stocks selected for their lower-volatility characteristics. Its top holdings tend to be concentrated in utilities, diversified financials and real estate, while its high-beta ETF counterpart is filled with many of the household names driving the AI narrative.
For a portfolio built around long-term growth companies, the low-volatility factor can be a useful complement when rate concerns start to pick up. The Low Vol/High Beta ratio below illustrates relative performance of the two factors. When this goes up, low volatility stocks are outperforming.
S&P 500 Low Volatility ETF vs. High Beta ETF

Top: S&P 500 Low Vol ETF / S&P 500 High Beta ETF Ratio; Middle: 40wk MA, 1-month Rate of Change; Bottom: Ratio’s distance from 40wk MA. Source: Stockcharts.com
Where We Go From Here
As of today, the overall equity market backdrop remains broadly bullish. AI is dominating the headlines (and for good reason) but there is plenty happening underneath the market beyond the AI trade to be encouraged about. With some exceptions, the current market rally has been broad with participation across countries, sectors, industries, and market-cap ranges.
Accordingly, I am not looking for the next “Big Short,” nor am I interested in fighting the market’s primary theme: the infrastructure buildout and broader application of artificial intelligence. While we have a healthy level of exposure to this theme, we are also focused on avoiding tunnel vision around the market’s latest shiny object for our clients. We continue to review and build portfolios around the market we are given, including new opportunities to allocate capital toward areas that may only now be starting to find their footing as alpha generators.